IFAC Safeprocess 2024 Competition
LiU-ICE Industrial Fault Diagnosis Benchmark
Anomaly Detection and Fault Isolation with Incomplete Data
** Latest update December 27th, 2023: Updated information text.
This homepage contains information about the LiU-ICE Industrial Fault Diagnosis Benchmark competition.
Please sign up for mailing list below to recieve news about updates **
The competition is part of the 12th IFAC Symposium on Fault Detection, Supervision and Safety for Technical Processes (Sateprocess), Ferrera, Italy.
Benchmark organizers and contact
- Daniel Jung, daniel.jung@liu.se, Department of Electrical Engineering, Linköping University, Sweden
- Erik Frisk, erik.frisk@liu.se, Department of Electrical Engineering, Linköping University, Sweden
- Mattias Krysander, mattias.krysander@liu.se, Department of Electrical Engineering, Linköping University, Sweden
How to participate
Information for competition participants will be updated on this homepage.
To receive news and information updates about the competition, register at link to be included in the mailing list.
There is no formal registration to participate in the competition but each team should send an email to daniel.jung@liu.se to inform that they intend to participate.
Each competing team can only submit one solution implemented in Matlab or Python (+ a documented description of their solution). Each participant can only be part of one team.
Submission deadline: April 21, 2024.
At least one representative of each of the competition finalists should to be present at the IFAC Safeprocess symposium.
Description
 This benchmark covers some challenging problems of fault diagnosis of technical systems. A diagnosis system gives important information to the control system, to monitor the health of the system, and select suitable countermeasures against system degradation and faults but also to assist technicians at the workshop to reduce downtime. The diagnosis system needs to identify the faulty component as fast and accurately as possible. However, it is also important to avoid misclassifications and falsely rejecting the true diagnosis since this can result in increased costs and reduced trust in the diagnosis system.
Fault diagnosis is complicated by model inaccuracies, measurement noise, and limited training data from relevant fault scenarios. Collecting representative training data from all relevant faults is a complicated and expensive task, and in some cases not even possible. Development of new fault diagnosis methods is needed to address these complicating factors, for example, by combining information from multiple sources, e.g.,
- mathematical models derived from physical insights about the system, and
- available training data from nominal and faulty scenarios to diagnose both known faults and unknown faults.
The objective of the competition is to address these challenges by designing a diagnosis system for the air path of an internal combustion engine. It is a challenging system because of its dynamic non-linear behavior and wide operating range. Due to feedback loops and strong coupling between components, a fault somewhere in the system will not have an isolated impact on that component but is likely to affect the behavior in other parts of the system as well. The set of available actuator and sensor signals corresponds to the standard signals that are available in a commercial vehicle. Considered faults include a leakage and sensor faults.
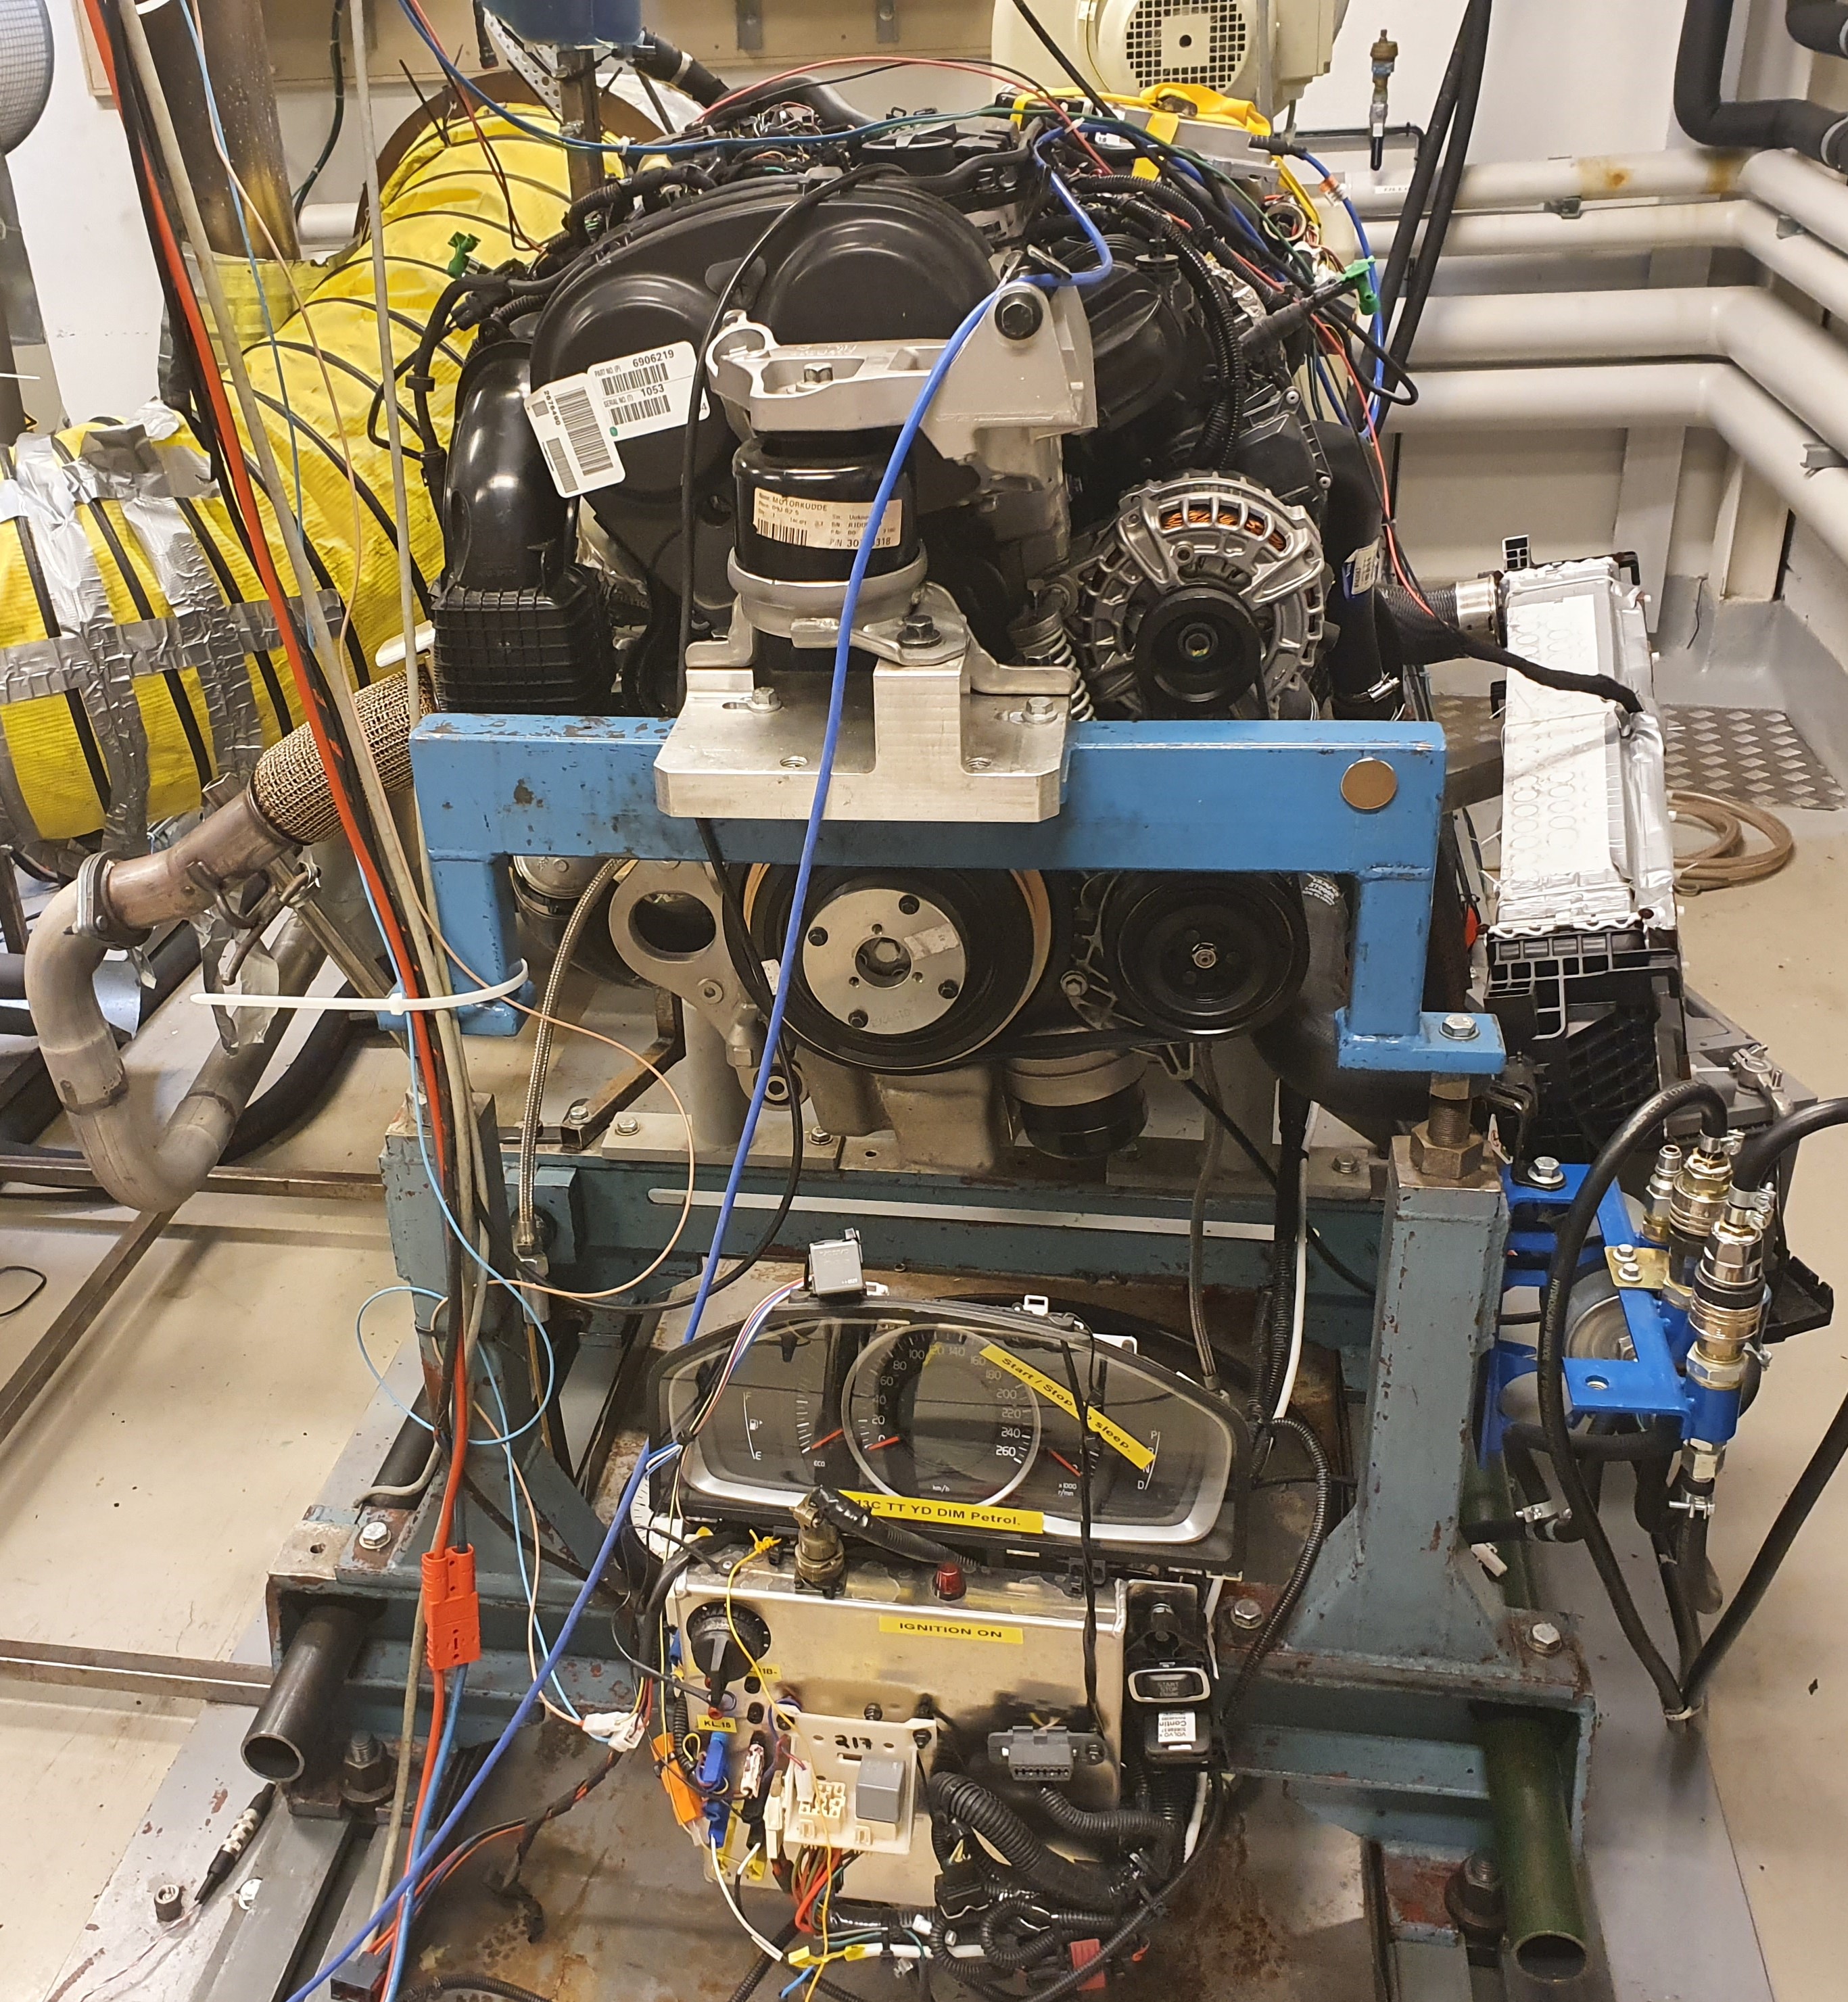
Data
The set of two actuator and eight sensor signals corresponds to the standard signals that are available in a commercial vehicle. The datasets have been collected from an engine test bench. Sensor and actuator signals have been collected from realistic operating conditions. Here, the realistic driving scenario is represented by different standard driving cycles. A vehicle and driver model has been used to control the engine to follow different driving cycles including both static and transient operation. Data is sampled in 20 Hz and stored in csv-format where the first column is the time vector ‘time’. Each row contain one sample of data.
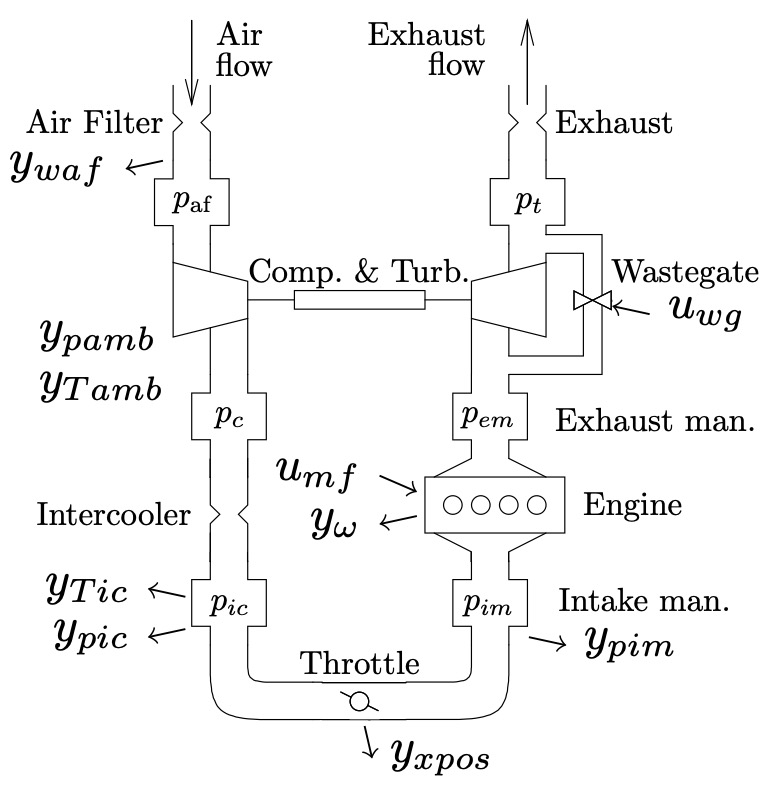
Avaiable sensor signals:
- Intercooler pressure - ypic
- Intercooler temperature - yTic
- Intake manifold pressure - ypim
- Mass flow through the air filter - ywaf
- Throttle actuator position - yxpos
- Engine speed - yomega
- Ambient pressure - ypamb
- Ambient temperature - yTamb
Available actuator signals:
- Requested injected fuel mass - umf
- Requested wastegate actuator position - uwg
The ambient pressure and temperature signals vary between different datasets mainly due to the ambient conditions in the lab and not due to faults.
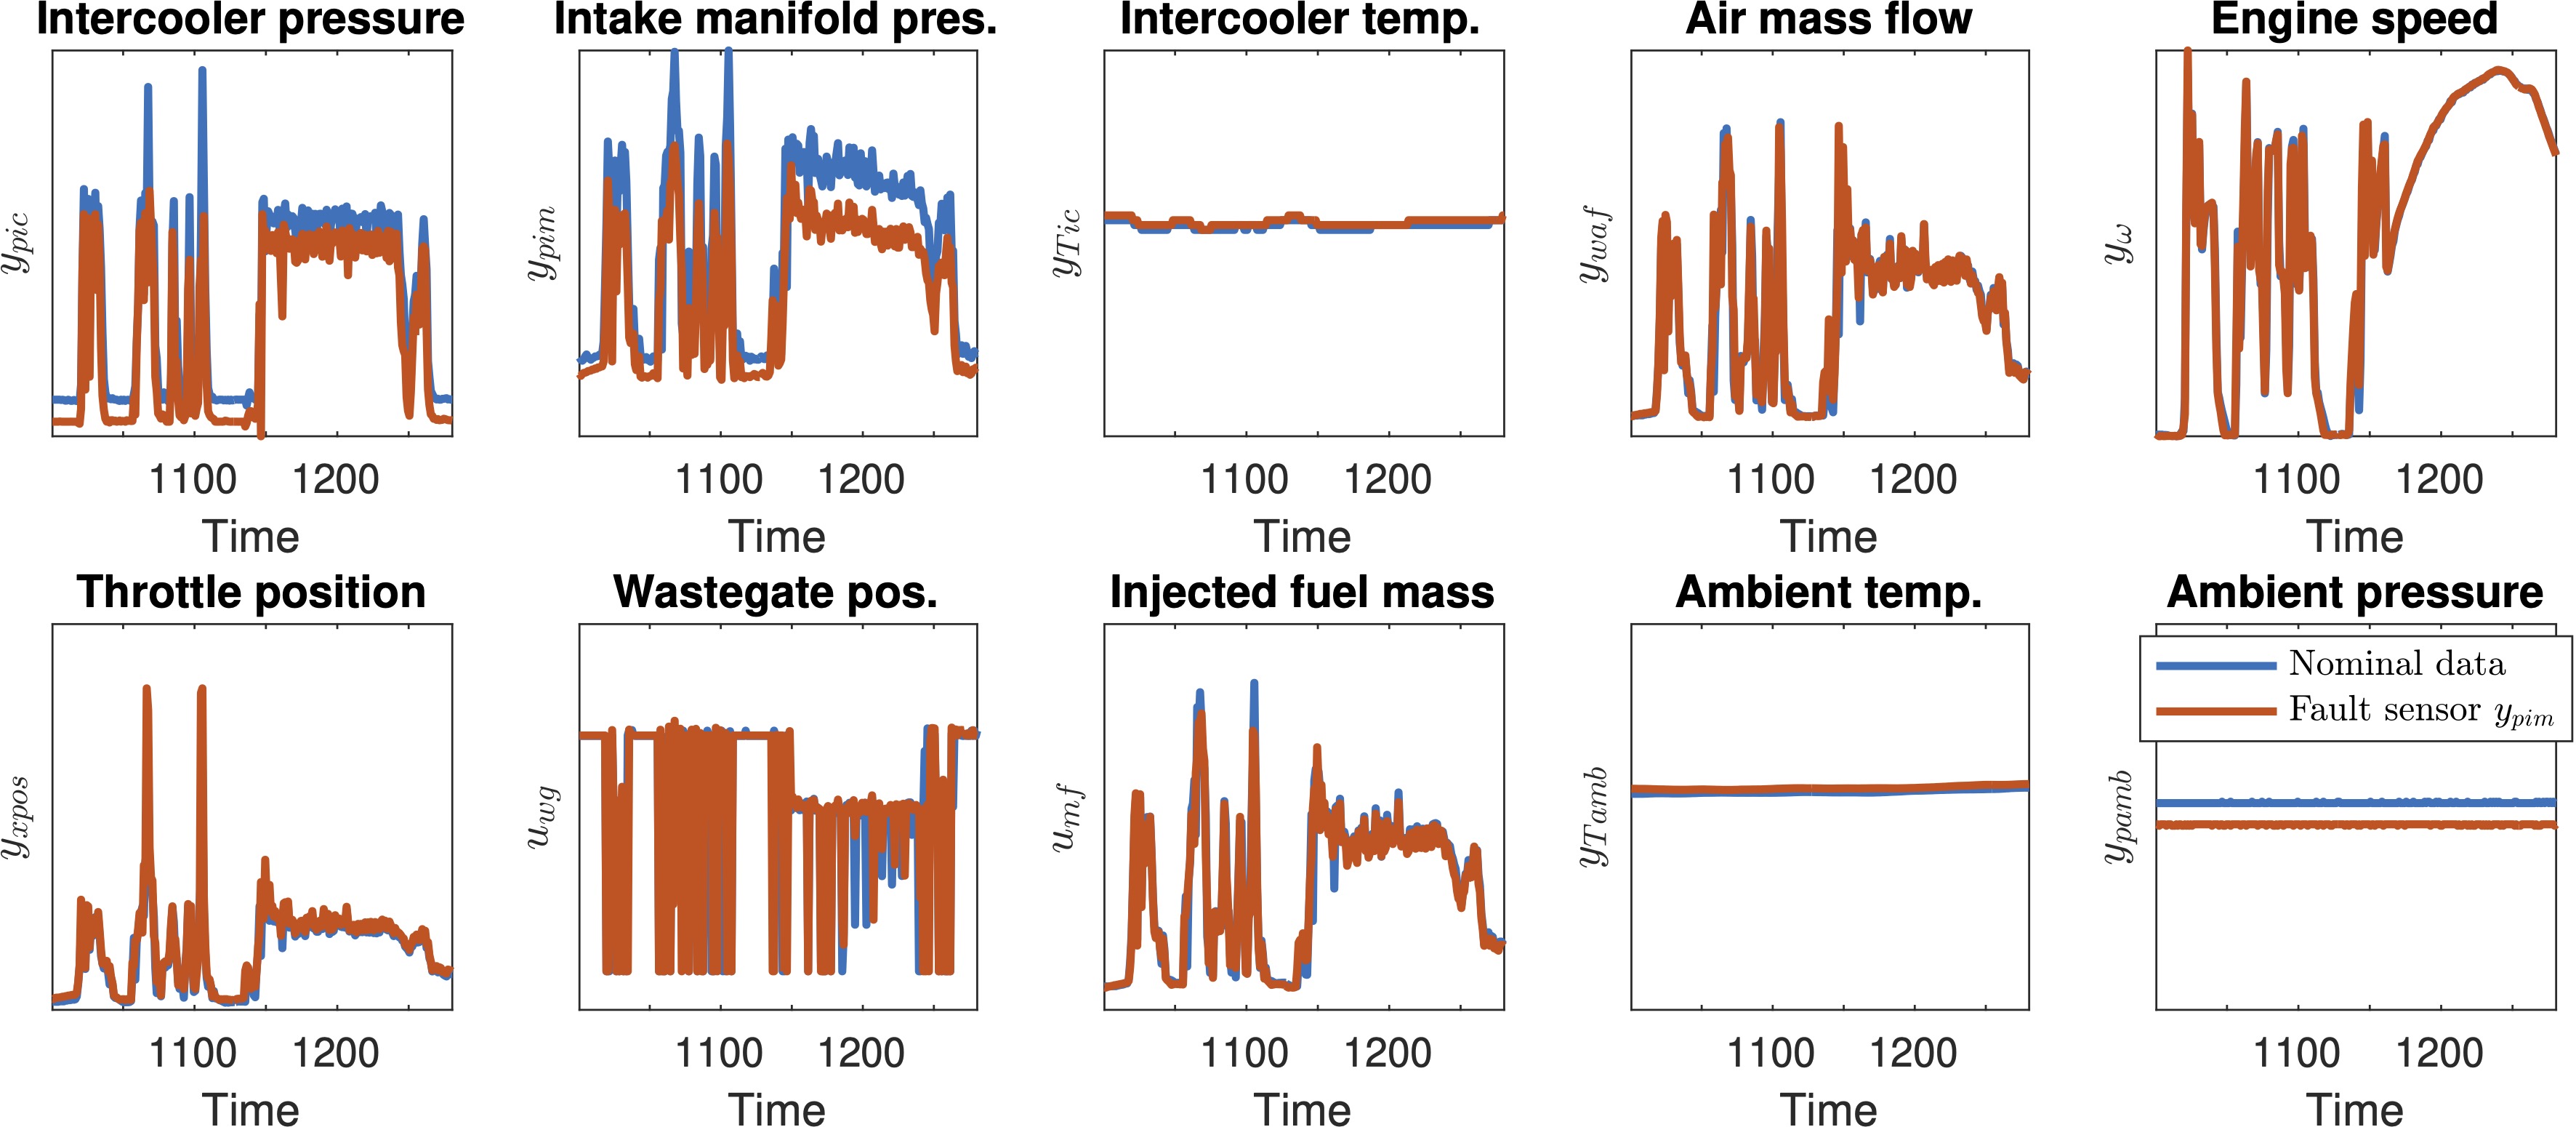
Fault scenarios
Each dataset contains data from one driving cycle. In the provided data, there is one dataset from nominal operation and seven datasets with different fault scenarios. Each dataset in the training data set contains one fault scenario including one fault-free dataset (NF - No Fault). In the training datasets containing faulty behavior, each fault is introduced approximately 120 s into each dataset and is present until the end of the dataset.
The considered known faults in the competition are:
- a leakage in the intake manifold
- (multiplicative) faults in the sensors measuring air mass flow - ywaf, intercooler pressure - ypic, and intake manifold pressure - ypim.
The sensor faults are introduced in the engine control unit by multiplying the measured signal x with a factor y = (1 + f)*x to get the sensor output y. A fault means that the factor f is not equal to 0. Note that the magnitude f could be both positive and negative. The sensor faults can affect the operation of the system, and not only the sensor output, due to feedback loops. The leakage is induced by opening a valve connected to the intake manifold.
Training data consists of eight datasets. The dataset contains one to two datasets from each known fault where each dataset contains one realization (magnitude) of each fault. Note that the training data is not representative of all fault magnitudes and the diagnosis system should be able to handle faults of different magnitudes. The naming of each dataset is done as follows:
‘driving_cycle’_‘fault’_‘fault magnitude’.csv
- driving cycle - In training data the Worldwide Harmonised Light Vehicles Test Procedure (WLTP) driving cycle has been used in all datasets to cover a wide range of operating conditions. Test data can contain other driving cycles.
- fault = {‘f_pic’ - fault in sensor ypic, ‘y_pim’ - fault in sensor ypim,’y_waf’ - fault in sensor ywaf,’f_iml’ - leakage in intake manifold}.
- fault magnitude - For sensor faults the number represents the fault f in y = (1 + f)*x where 090 means (1 + f) = 0.90, i.e. a 10% reduction in the sensor output, and 110 means (1 + f) = 1.10, i.e. a 10% increase in the sensor output. For the leakage fault 6mm refers to the oriface diameter.
Resources – models, and code
We provide a set of training data from both nominal and faulty operations. Training data can be downloaded from this link.
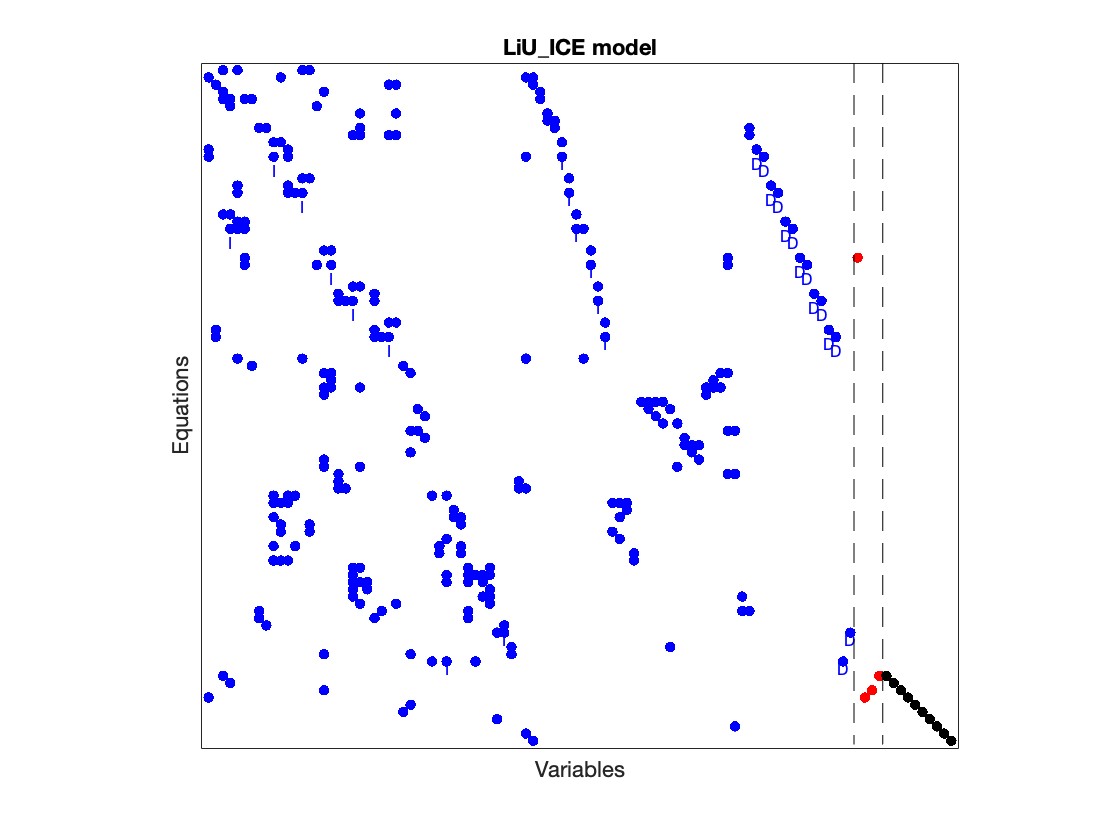
We provide a system description in the form of a state-of-the-art analytical model where model parameters are unknown. Note that the set of available signals is not sufficient to uniquely determine the model parameters. The model follows the same model structure as described in:
Modeling and control of turbocharged SI and DI engines
L Eriksson
Oil & Gas Science and Technology-Revue de l’IFP 62 (4), 523-538
The provided model is implemented in Fault Diagnosis Toolbox which is available in both Matlab and Python. The model can be downloaded here:
- matlab (engine_model.m, main.m)
- python (engine_model.py, main.py)
The figure below is generated using the Fault Diagnosis Toolbox shows a structural representation of the mathematical model. Each row represents an equation and each column a model variable where blue are unknown variables, red are fault signals, and black are known signals.
Description of the diagnosis system interface and evaluation script
The developed diagnosis system solution must be implemented in either Matlab or Python. We have provided an empty DiagnosisSystem class which has the following functions:
- Initialization()
- detection, isolation = Input(sample) The developed diagnosis system must have these functions with the same input and outputs as these are the only interface used by the evaluation script.
The evaluation environment, the basic diagnosis system class, and an example can be downloaded here:
- matlab (file_structure_matlab.zip)
- python (file_structure_python.zip)
The evaluate_diagnosis_system.m file is the environment where the diagnosis system is intiated and evaluated using a selected test dataset. Here, the example diagnosis system has been calibrated in advance and is load from a parameter file during initialization. When evaluating the diagnosis system using a given dataset, the diagnosis system is fed with a new sample each time instance and the output from the diagnosis system is saved to a csv-file. The diagnosis system can update its diagnosis output after each sample but it cannot change a output from at a previous time instance.
The DiagnosisSystemClass contains the structure of the functions that are used to interact with the evaluation environment.
Assume that DS is the instance of the diagnosis system class. The diagnosis system is initialized by calling the class function DS.Initialization(). It is allowed to load precalibrated diagnosis system parameters from a file in the Initialization() function. The example diagnosis system has a Train()-function that calibrates the diagnosis system using the provided training data and saves the diagnosis system parameters to a calibration file (here exampleDiagnosisSystemParameters.mat (matlab) or exampleDiagnosisSystemParameters.obj (python).
When evaluating the diagnosis system, at each time a new sample is fed to the diagnosis system using the function Input(sample). Here is where the diagnosis system functionality is called. At each time, i.e. efter each sample, the diagnosis system should return a diagnosis output. This is divided in two outputs:
- detection (dim 1, boolean) - is a flag stating when a fault has been detected (detection = 0 if no fault and 1 if fault).
- isolation (dim 1x5, float) - non-negative ranking of diagnosis candidates in the following order: (f_pic,f_pim,f_waf,f_iml,f_x) where f_x is the ranking that the detected fault is none of the known faults. If detection = 0, the sum of elements in isolation = 0 and if detection = 1, the sum of elements in isolation = 1.
Evaluation criteria
The solution shall be submitted to the organizers together with documentation describing the implementation before the final date. The code should be executable in Matlab or Python and cannot include other licenced software.
The competing diagnosis system solutions will be evaluated based on the following criteria:
- False alarm rate
- Missed detection rate
- Time from fault occurrence until detection
- Fault isolation accuracy (*)
- Computation time
(*) Fault isolation accuracy is evaluated based on the ranking of the true diagnosis candidate has after a fault has been detected.
The solution should be calibrated using only provided training data. For the final evaluation, a set of secret test data will be used to evaluate all participating solutions. The total score of each solution is based on the sum of a weighted ranking in these categories with respect to the other participants.
Related references
Here is a list of some publications that have used data from the same engine test bench
Data-driven fault diagnosis analysis and open-set classification of time-series data
A Lundgren, D Jung
Control Engineering Practice, 2022.
Automated design of grey-box recurrent neural networks for fault diagnosis using structural models and causal information
D Jung
Learning for Dynamics and Control Conference. PMLR, 2022.
A toolbox for analysis and design of model based diagnosis systems for large scale models
E Frisk, M Krysander, and D Jung
20th IFAC World Congress, Volume 50, Issue 1, July 2017, Pages 3287-3293.